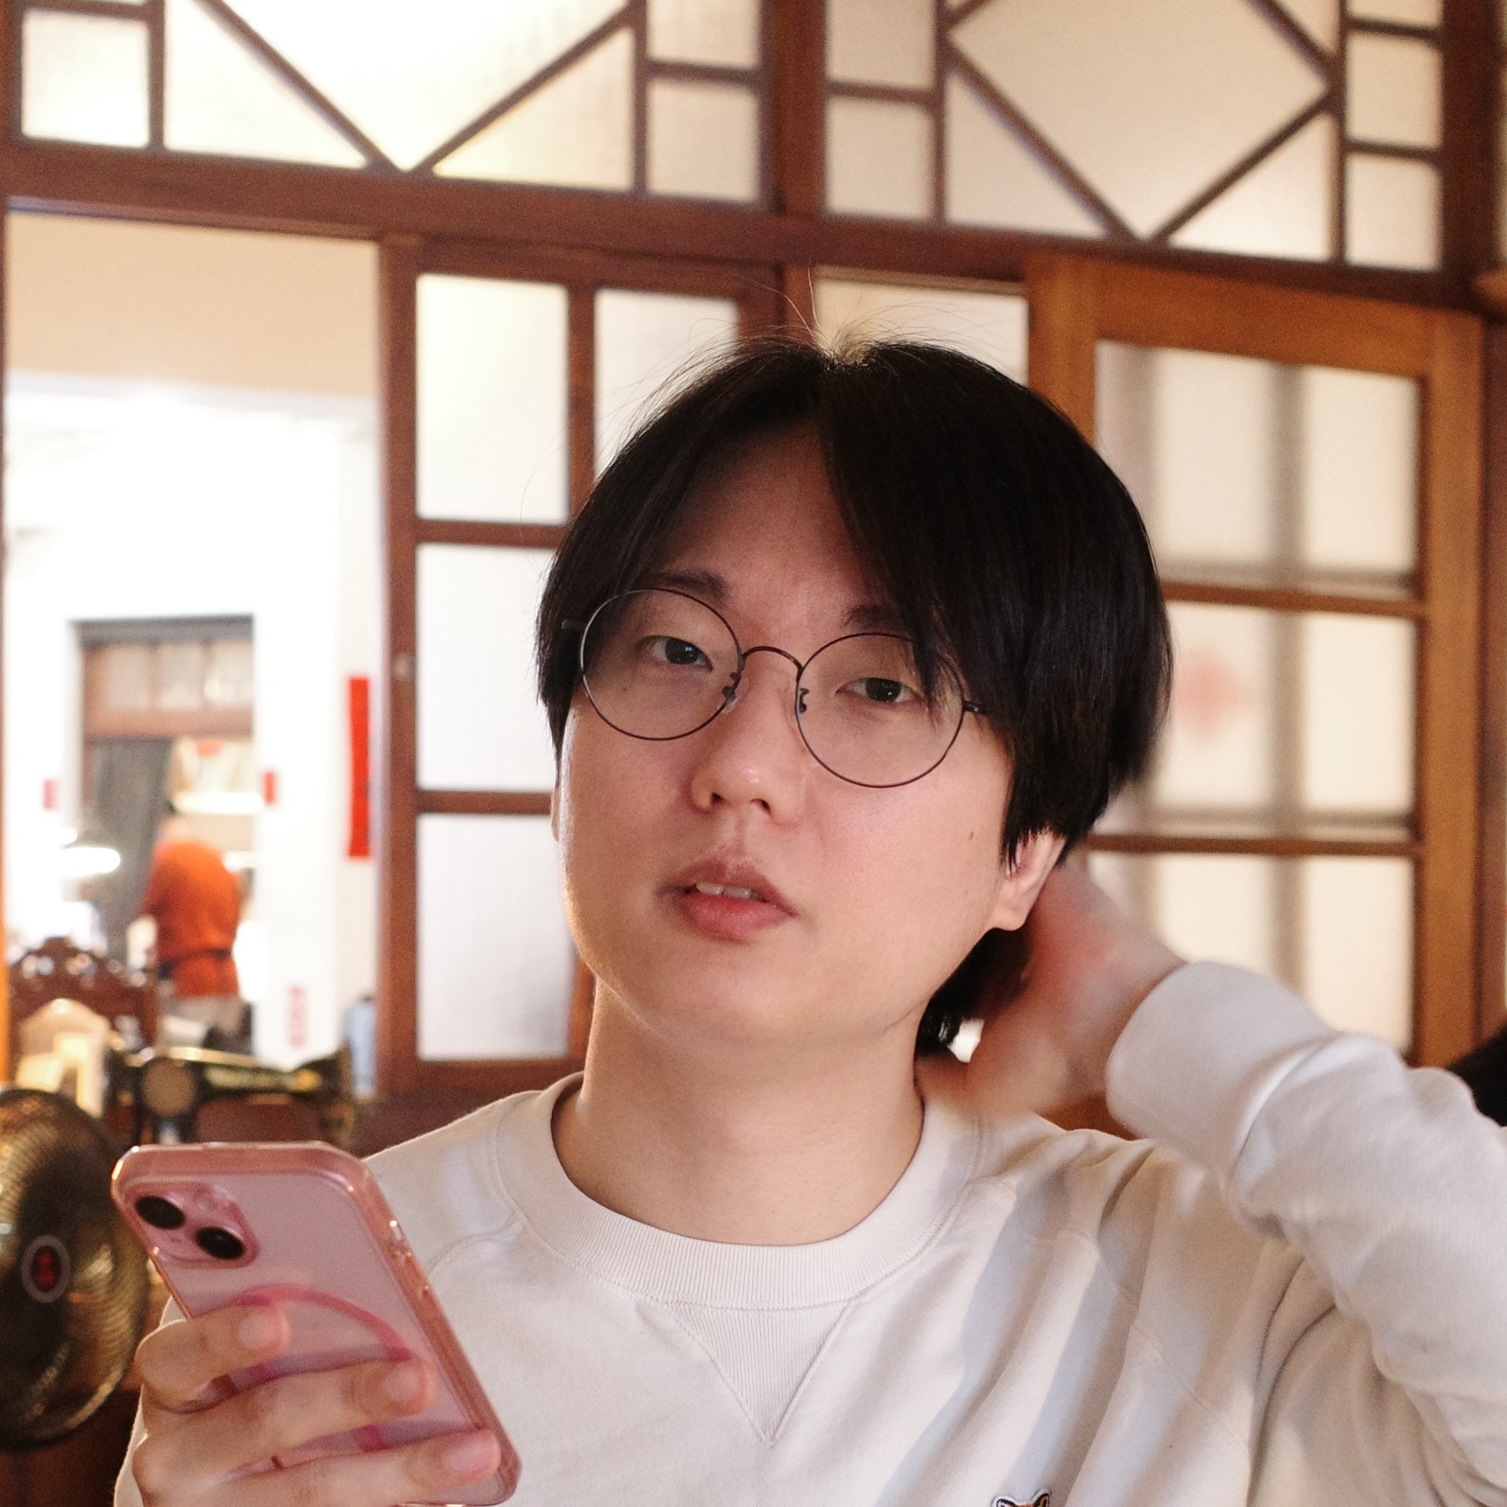
Hello, I'm an open source software engineer in my late 30s living in #Seoul, #Korea, and an avid advocate of #FLOSS and the #fediverse.
I'm the creator of @fedify, an #ActivityPub server framework in #TypeScript, @hollo, an ActivityPub-enabled microblogging software for single users, and @botkit, a simple ActivityPub bot framework.
Currently, each BotKit instance can only run a single bot. We're redesigning the architecture to let you host multiple bots—both static and dynamically created—on a single instance.
When I started building Fedify, an ActivityPub server framework, I ran into a problem that surprised me: I couldn't figure out how to add logging.
Not because logging is hard—there are dozens of mature logging libraries for JavaScript. The problem was that they're primarily designed for applications, not for libraries that want to stay unobtrusive.
I wrote about this a few months ago, and the response was modest—some interest, some skepticism, and quite a bit of debate about whether the post was AI-generated. I'll be honest: English isn't my first language, so I use LLMs to polish my writing. But the ideas and technical content are mine.
Several readers wanted to see a real-world example rather than theory.
The problem: existing loggers assume you're building an app
Fedify helps developers build federated social applications using the ActivityPub protocol. If you've ever worked with federation, you know debugging can be painful. When an activity fails to deliver, you need to answer questions like:
Did the HTTP request actually go out?
Was the signature generated correctly?
Did the remote server reject it? Why?
Was there a problem parsing the response?
These questions span multiple subsystems: HTTP handling, cryptographic signatures, JSON-LD processing, queue management, and more. Without good logging, debugging turns into guesswork.
But here's the dilemma I faced as a library author: if I add verbose logging to help with debugging, I risk annoying users who don't want their console cluttered with Fedify's internal chatter. If I stay silent, users struggle to diagnose issues.
I looked at the existing options. With winston or Pino, I would have to either:
Configure a logger inside Fedify (imposing my choices on users), or
Ask users to pass a logger instance to Fedify (adding boilerplate)
There's also debug, which is designed for this use case. But it doesn't give you structured, level-based logs that ops teams expect—and it relies on environment variables, which some runtimes like Deno restrict by default for security reasons.
None of these felt right. So I built LogTape—a logging library designed from the ground up for library authors. And Fedify became its first real user.
The solution: hierarchical categories with zero default output
The key insight was simple: a library should be able to log without producing any output unless the application developer explicitly enables it.
Fedify uses LogTape's hierarchical category system to give users fine-grained control over what they see. Here's how the categories are organized:
Category
What it logs
["fedify"]
Everything from the library
["fedify", "federation", "inbox"]
Incoming activities
["fedify", "federation", "outbox"]
Outgoing activities
["fedify", "federation", "http"]
HTTP requests and responses
["fedify", "sig", "http"]
HTTP Signature operations
["fedify", "sig", "ld"]
Linked Data Signature operations
["fedify", "sig", "key"]
Key generation and retrieval
["fedify", "runtime", "docloader"]
JSON-LD document loading
["fedify", "webfinger", "lookup"]
WebFinger resource lookups
…and about a dozen more. Each category corresponds to a distinct subsystem.
This means a user can configure logging like this:
await configure({ sinks: { console: getConsoleSink() }, loggers: [ // Show errors from all of Fedify { category: "fedify", sinks: ["console"], lowestLevel: "error" }, // But show debug info for inbox processing specifically { category: ["fedify", "federation", "inbox"], sinks: ["console"], lowestLevel: "debug" }, ],});
When something goes wrong with incoming activities, they get detailed logs for that subsystem while keeping everything else quiet. No code changes required—just configuration.
Request tracing with implicit contexts
The hierarchical categories solved the filtering problem, but there was another challenge: correlating logs across async boundaries.
In a federated system, a single user action might trigger a cascade of operations: fetch a remote actor, verify their signature, process the activity, fan out to followers, and so on. When something fails, you need to correlate all the log entries for that specific request.
Fedify uses LogTape's implicit context feature to automatically tag every log entry with a requestId:
With this configuration, every log entry automatically includes a requestId property. When you need to debug a specific request, you can filter your logs:
And you'll see every log entry from that request—across all subsystems, all in order. No manual correlation needed.
The requestId is derived from standard headers when available (X-Request-Id, Traceparent, etc.), so it integrates naturally with existing observability infrastructure.
What users actually see
So what does all this configuration actually mean for someone using Fedify?
If a Fedify user doesn't configure LogTape at all, they see nothing. No warnings about missing configuration, no default output, and minimal performance overhead—the logging calls are essentially no-ops.
For basic visibility, they can enable error-level logging for all of Fedify with three lines of configuration. When debugging a specific issue, they can enable debug-level logging for just the relevant subsystem.
And if they're running in production with serious observability requirements, they can pipe structured JSON logs to their monitoring system with request correlation built in.
The same library code supports all these scenarios—whether the user is running on Node.js, Deno, Bun, or edge functions, without extra polyfills or shims. The user decides what they need.
Lessons learned
Building Fedify with LogTape taught me a few things:
Design your categories early. The hierarchical structure should reflect how users will actually want to filter logs. I organized Fedify's categories around subsystems that users might need to debug independently.
Use structured logging. Properties like requestId, activityId, and actorId are far more useful than string interpolation when you need to analyze logs programmatically.
Implicit contexts turned out to be more useful than I expected. Being able to correlate logs across async boundaries without passing context manually made debugging distributed operations much easier. When a user reports that activity delivery failed, I can give them a single jq command to extract everything relevant.
Trust your users. Some library authors worry about exposing too much internal detail through logs. I've found the opposite—users appreciate being able to see what's happening when they need to. The key is making it opt-in.
Try it yourself
If you're building a library and struggling with the logging question—how much to log, how to give users control, how to avoid being noisy—I'd encourage you to look at how Fedify does it.
The Fedify logging documentation explains everything in detail. And if you want to understand the philosophy behind LogTape's design, my earlier post covers that.
LogTape isn't trying to replace winston or Pino for application developers who are happy with those tools. It fills a different gap: logging for libraries that want to stay out of the way until users need them. If that's what you're looking for, it might be a better fit than the usual app-centric loggers.
Deno 2.6 is here: 🛠️ `dx` is the new `npx` ⚡ faster typechecking with tsgo 🔒 improved security with `deno audit --socket` 🦺 safer deps with `deno approve-scripts` 🚘 source phase import support and more!
리차드 스톨만, "ChatGPT를 사용하지 말아야 하는 이유" ------------------------------ - Richard Stallman 은 ChatGPT가 *지능을 갖지 않은 시스템* 이며, 단지 단어를 조합할 뿐 의미를 이해하지 못한다고 지적 - 이 시스템은 *진실 여부에 무관하게 출력물을 생성* 하기 때문에, 그는 이를 “*허튼소리 생성기(bullshit generator)* ” 라고 부름 - 이러한 *생성형 시스템에 지능을 부여하는 대… ------------------------------ https://news.hada.io/topic?id=24995&utm_source=googlechat&utm_medium=bot&utm_campaign=1834
“Transgender for everybody”, but unironically. As in, spend some time deconstructing your gender and then actively choose what gender roles and expressions you actually do and don’t want to perform. Deconstruct your sexuality too. Deconstruct your religion. Deconstruct anything you were indoctrinated into so you can be authentically you
If you've built CLI tools, you've written code like this:
if (opts.reporter === "junit" && !opts.outputFile) { throw new Error("--output-file is required for junit reporter");}if (opts.reporter === "html" && !opts.outputFile) { throw new Error("--output-file is required for html reporter");}if (opts.reporter === "console" && opts.outputFile) { console.warn("--output-file is ignored for console reporter");}
In the code above, --output-file only makes sense when --reporter is junit or html. When it's console, the option shouldn't exist at all.
We're using TypeScript. We have a powerful type system. And yet, here we are, writing runtime checks that the compiler can't help with. Every time we add a new reporter type, we need to remember to update these checks. Every time we refactor, we hope we didn't miss one.
The state of TypeScript CLI parsers
The old guard—Commander, yargs, minimist—were built before TypeScript became mainstream. They give you bags of strings and leave type safety as an exercise for the reader.
But we've made progress. Modern TypeScript-first libraries like cmd-ts and Clipanion (the library powering Yarn Berry) take types seriously:
These libraries infer types for individual options. --port is a number. --verbose is a boolean. That's real progress.
But here's what they can't do: express that --output-file is required when--reporter is junit, and forbidden when--reporter is console. The relationship between options isn't captured in the type system.
So you end up writing validation code anyway:
handler: (args) => { // Both cmd-ts and Clipanion need this if (args.reporter === "junit" && !args.outputFile) { throw new Error("--output-file required for junit"); } // args.outputFile is still string | undefined // TypeScript doesn't know it's definitely string when reporter is "junit"}
Rust's clap and Python's Click have requires and conflicts_with attributes, but those are runtime checks too. They don't change the result type.
If the parser configuration knows about option relationships, why doesn't that knowledge show up in the result type?
Modeling relationships with conditional()
Optique treats option relationships as a first-class concept. Here's the test reporter scenario:
The conditional() combinator takes a discriminator option (--reporter) and a map of branches. Each branch defines what other options are valid for that discriminator value.
TypeScript infers the result type automatically:
type Result = | ["console", {}] | ["junit", { outputFile: string }] | ["html", { outputFile: string; openBrowser: boolean }];
When reporter is "junit", outputFile is string—not string | undefined. The relationship is encoded in the type.
Now your business logic gets real type safety:
const [reporter, config] = run(parser);switch (reporter) { case "console": runWithConsoleOutput(); break; case "junit": // TypeScript knows config.outputFile is string writeJUnitReport(config.outputFile); break; case "html": // TypeScript knows config.outputFile and config.openBrowser exist writeHtmlReport(config.outputFile); if (config.openBrowser) openInBrowser(config.outputFile); break;}
No validation code. No runtime checks. If you add a new reporter type and forget to handle it in the switch, the compiler tells you.
A more complex example: database connections
Test reporters are a nice example, but let's try something with more variation. Database connection strings:
Notice the details: PostgreSQL defaults to port 5432, MySQL to 3306. PostgreSQL has an optional password, MySQL has an SSL flag. Each database type has exactly the options it needs—no more, no less.
With this structure, writing dbConfig.ssl when the mode is sqlite isn't a runtime error—it's a compile-time impossibility.
Try expressing this with requires_if attributes. You can't. The relationships are too rich.
The pattern is everywhere
Once you see it, you find this pattern in many CLI tools:
Deployment targets, output formats, connection protocols—anywhere you have a mode selector that determines what other options are valid.
Why conditional() exists
Optique already has an or() combinator for mutually exclusive alternatives. Why do we need conditional()?
The or() combinator distinguishes branches based on structure—which options are present. It works well for subcommands like git commit vs git push, where the arguments differ completely.
But in the reporter example, the structure is identical: every branch has a --reporter flag. The difference lies in the flag's value, not its presence.
// This won't work as intendedconst parser = or( object({ reporter: option("--reporter", choice(["console"])) }), object({ reporter: option("--reporter", choice(["junit", "html"])), outputFile: option("--output-file", string()) }),);
When you pass --reporter junit, or() tries to pick a branch based on what options are present. Both branches have --reporter, so it can't distinguish them structurally.
conditional() solves this by reading the discriminator's value first, then selecting the appropriate branch. It bridges the gap between structural parsing and value-based decisions.
The structure is the constraint
Instead of parsing options into a loose type and then validating relationships, define a parser whose structure is the constraint.
Traditional approach
Optique approach
Parse → Validate → Use
Parse (with constraints) → Use
Types and validation logic maintained separately
Types reflect the constraints
Mismatches found at runtime
Mismatches found at compile time
The parser definition becomes the single source of truth. Add a new reporter type? The parser definition changes, the inferred type changes, and the compiler shows you everywhere that needs updating.
I posted a blog entry to wrap up the year: My 2025 with the fediverse. I'm grateful that the fediverse has allowed me to connect with so many people. I look forward to our continued connection.