Fedify 1.10.0: Observability foundations for the future debug dashboard
Fedify is a #TypeScript framework for building #ActivityPub servers that participate in the #fediverse. It reduces the complexity and boilerplate typically required for ActivityPub implementation while providing comprehensive federation capabilities.
We're excited to announce #Fedify 1.10.0, a focused release that lays critical groundwork for future debugging and observability features. Released on December 24, 2025, this version introduces infrastructure improvements that will enable the upcoming debug dashboard while maintaining full backward compatibility with existing Fedify applications.
This release represents a transitional step toward Fedify 2.0.0, introducing optional capabilities that will become standard in the next major version. The changes focus on enabling richer observability through OpenTelemetry enhancements and adding prefix scanning capabilities to the key–value store interface.
Enhanced OpenTelemetry instrumentation
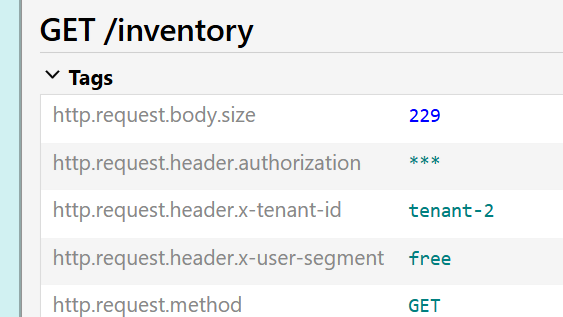
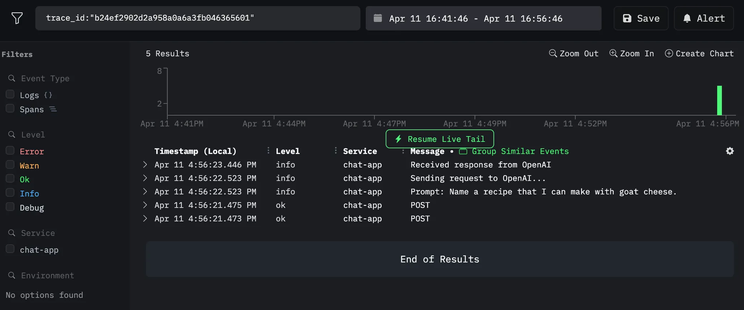
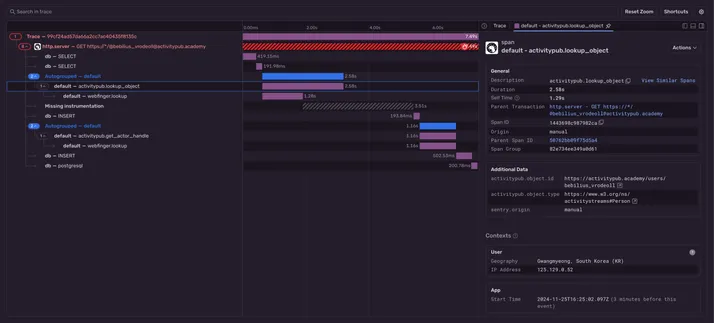
Fedify 1.10.0 significantly expands OpenTelemetry instrumentation with span events that capture detailed ActivityPub data. These enhancements enable richer observability and debugging capabilities without relying solely on span attributes, which are limited to primitive values.
The new span events provide complete activity payloads and verification status, making it possible to build comprehensive debugging tools that show the full context of federation operations:
activitypub.activity.received event on activitypub.inbox span — records the full activity JSON, verification status (activity verified, HTTP signatures verified, Linked Data signatures verified), and actor informationactivitypub.activity.sent event on activitypub.send_activity span — records the full activity JSON and target inbox URLactivitypub.object.fetched event on activitypub.lookup_object span — records the fetched object's type and complete JSON-LD representation
Additionally, Fedify now instruments previously uncovered operations:
activitypub.fetch_document span for document loader operations, tracking URL fetching, HTTP redirects, and final document URLsactivitypub.verify_key_ownership span for cryptographic key ownership verification, recording actor ID, key ID, verification result, and the verification method used
These instrumentation improvements emerged from work on issue #234 (Real-time ActivityPub debug dashboard). Rather than introducing a custom observer interface as originally proposed in #323, we leveraged Fedify's existing OpenTelemetry infrastructure to capture rich federation data through span events. This approach provides a standards-based foundation that's composable with existing observability tools like Jaeger, Zipkin, and Grafana Tempo.
Distributed trace storage with FedifySpanExporter
Building on the enhanced instrumentation, Fedify 1.10.0 introduces FedifySpanExporter, a new OpenTelemetry SpanExporter that persists ActivityPub activity traces to a KvStore. This enables distributed tracing support across multiple nodes in a Fedify deployment, which is essential for building debug dashboards that can show complete request flows across web servers and background workers.
The new @fedify/fedify/otel module provides the following types and interfaces:
import { MemoryKvStore } from "@fedify/fedify";
import { FedifySpanExporter } from "@fedify/fedify/otel";
import {
  BasicTracerProvider,
  SimpleSpanProcessor,
} from "@opentelemetry/sdk-trace-base";

const kv = new MemoryKvStore();
const exporter = new FedifySpanExporter(kv, {
  ttl: Temporal.Duration.from({ hours: 1 }),
});

const provider = new BasicTracerProvider();
provider.addSpanProcessor(new SimpleSpanProcessor(exporter));
The stored traces can be queried for display in debugging interfaces:
// Get all activities for a specific trace
const activities = await exporter.getActivitiesByTraceId(traceId);

// Get recent traces with summary information
const recentTraces = await exporter.getRecentTraces({ limit: 100 });
The exporter supports two storage strategies depending on the KvStore capabilities. When the list() method is available (preferred), it stores individual records with keys like [prefix, traceId, spanId]. When only cas() is available, it uses compare-and-swap operations to append records to arrays stored per trace.
This infrastructure provides the foundation for implementing a comprehensive debug dashboard as a custom SpanExporter, as outlined in the updated implementation plan for issue #234.
Optional list() method for KvStore interface
Fedify 1.10.0 adds an optional list() method to the KvStore interface for enumerating entries by key prefix. This method enables efficient prefix scanning, which is useful for implementing features like distributed trace storage, cache invalidation by prefix, and listing related entries.
interface KvStore {
  // ... existing methods
  list?(prefix?: KvKey): AsyncIterable<KvStoreListEntry>;
}
When the prefix parameter is omitted or empty, list() returns all entries in the store. This is useful for debugging and administrative purposes. All official KvStore implementations have been updated to support this method:
MemoryKvStore — filters in-memory keys by prefixSqliteKvStore — uses LIKE query with JSON key patternPostgresKvStore — uses array slice comparisonRedisKvStore — uses SCAN with pattern matching and key deserializationDenoKvStore — delegates to Deno KV's built-in list() APIWorkersKvStore — uses Cloudflare Workers KV list() with JSON key prefix pattern
While list() is currently optional to give existing custom KvStore implementations time to add support, it will become a required method in Fedify 2.0.0 (tracked in issue #499). This migration path allows implementers to gradually adopt the new capability throughout the 1.x release cycle.
The addition of list() support was implemented in pull request #500, which also included the setup of proper testing infrastructure for WorkersKvStore using Vitest with @cloudflare/vitest-pool-workers.
NestJS 11 and Express 5 support
Thanks to a contribution from Cho Hasang (@crohasang), the @fedify/nestjs package now supports NestJS 11 environments that use Express 5. The peer dependency range for Express has been widened to ^4.0.0 || ^5.0.0, eliminating peer dependency conflicts in modern NestJS projects while maintaining backward compatibility with Express 4.
This change, implemented in pull request #493, keeps the workspace catalog pinned to Express 4 for internal development and test stability while allowing Express 5 in consuming applications.
What's next
Fedify 1.10.0 serves as a stepping stone toward the upcoming 2.0.0 release. The optional list() method introduced in this version will become required in 2.0.0, simplifying the interface contract and allowing Fedify internals to rely on prefix scanning being universally available.
The enhanced #OpenTelemetry instrumentation and FedifySpanExporter provide the foundation for implementing the debug dashboard proposed in issue #234. The next steps include building the web dashboard UI with real-time activity lists, filtering, and JSON inspection capabilities—all as a separate package that leverages the standards-based observability infrastructure introduced in this release.
Depending on the development timeline and feature priorities, there may be additional 1.x releases before the 2.0.0 migration. For developers building custom KvStore implementations, now is the time to add list() support to prepare for the eventual 2.0.0 upgrade. The implementation patterns used in the official backends provide clear guidance for various storage strategies.
Acknowledgments
Special thanks to Cho Hasang (@crohasang) for the NestJS 11 compatibility improvements, and to all community members who provided feedback and testing for the new observability features.
For the complete list of changes, bug fixes, and improvements, please refer to the CHANGES.md file in the repository.
#fedidev #release